North American Benzene: Boom or Bust?
Overview
To say that the North American benzene, aromatics, and octane markets have underperformed thus far this year would probably be an understatement given the expectations of most participants and prognosticators, particularly when compared with the events of 2022. This is not to say that something extraordinary might not yet happen this summer, but time has run out before the US (United States) Memorial Holiday, which arrived last week and with it the symbolic beginning of peak summer gasoline and octane demand.
To be clear, early this spring, all the signals pointed to a dramatic upturn in demand and prices although nobody expected a full-on repeat of last year’s extraordinary events. For North America, the signs pointed to higher demand and prices especially when considering benzene derivative demand and gasoline inventory. That said, there are now just as many counterpoints as there are points and pessimism has more than offset the bullish fundamentals.
The Recap of 2022
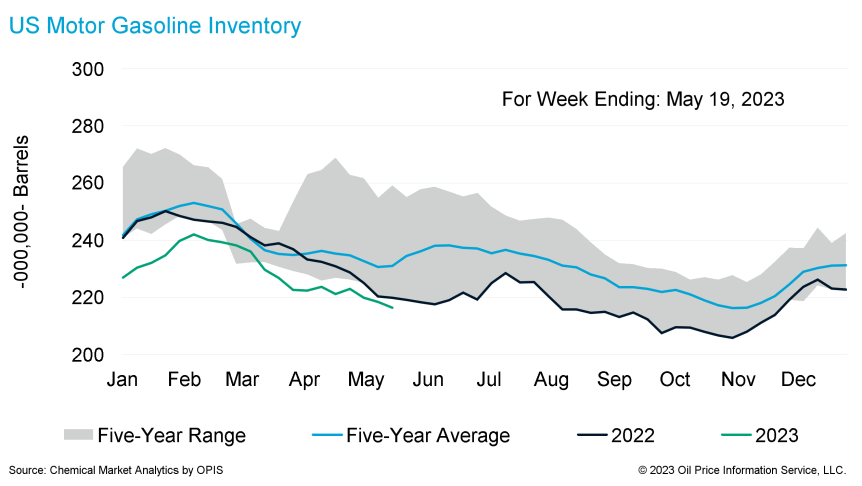
Starting with a short recap of last year, we can recall that according to the EIA (Energy Information Administration), total motor gasoline inventory in the US including blend components set five-year lows from March through December of last year. The situation was compounded by the fact that refiners under-anticipated gasoline demand and refinery operating rates did not reach rates above 90% until February of last year.
Meanwhile, on the other side of the world, the Russian-Ukrainian conflict escalated in late February which sent crude oil prices soaring with WTI (West Texas Intermediate) peaking at over $120 per barrel in early June. Natural gas prices also spiked worldwide driving incremental variable costs of production higher for most energy-intensive industries like refining and chemicals.
Even though US refineries ran at rates higher than 90% for most of 2022, gasoline inventory continued to languish, particularly for high-octane components. High-octane blend components were in great demand to blend up low-octane naphtha which had no home in steam crackers and whose only disposition was into the gasoline blend pool. Thus, traders and blenders began to source non-typical aromatic streams like cumene, ethylbenzene, and paraxylene to boost octane.
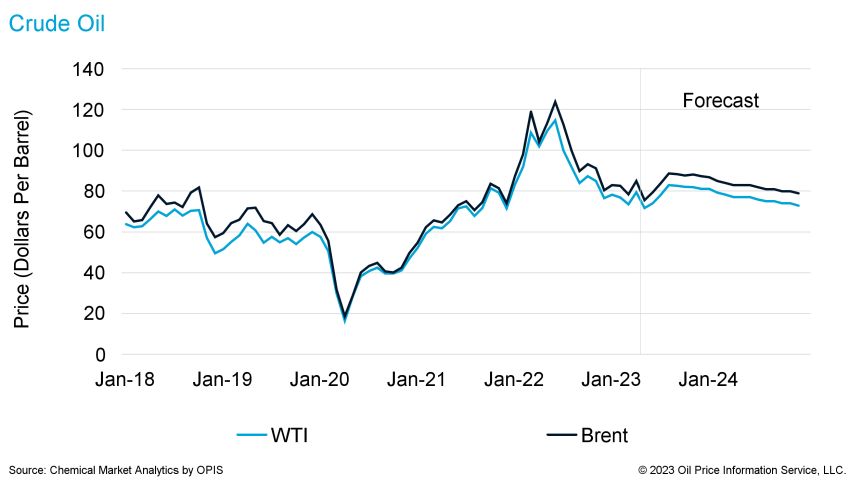
This alternative octane sourcing, however, did not begin to occur in earnest until late summer and by then it was too little and too late, and the damage was done. Daily spot prices for benzene, toluene, and mixed xylenes doubled from $3.50 per gallon in January to over $7.00 per gallon by mid-June in conjunction with the crude oil price spike. Supply was tight and demand was too great, and imports could not be sourced quickly enough to cover.
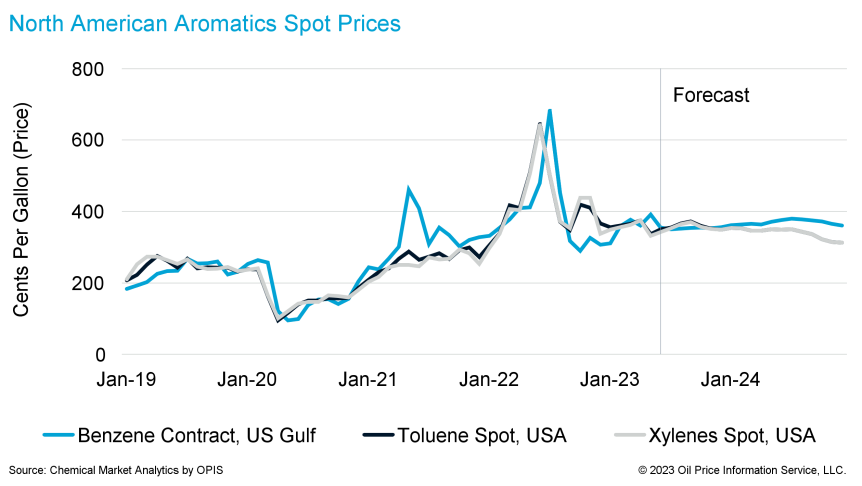
Another implication of soaring aromatics prices was the worsening of TDP (Toluene Disproportionation) and STDP (Selective TDP) conversion economics. Simply, toluene became too valuable as a blend component and too expensive as a feedstock to produce mixed xylenes and paraxylene. Thus, most of the TDP and STDP units were idled for the second half of the year liberating toluene for gasoline blending while reducing the production of mixed xylenes and co-product benzene. This further tightened benzene balances since approximately 11% of North American benzene supply comes from TDP and STDP units.
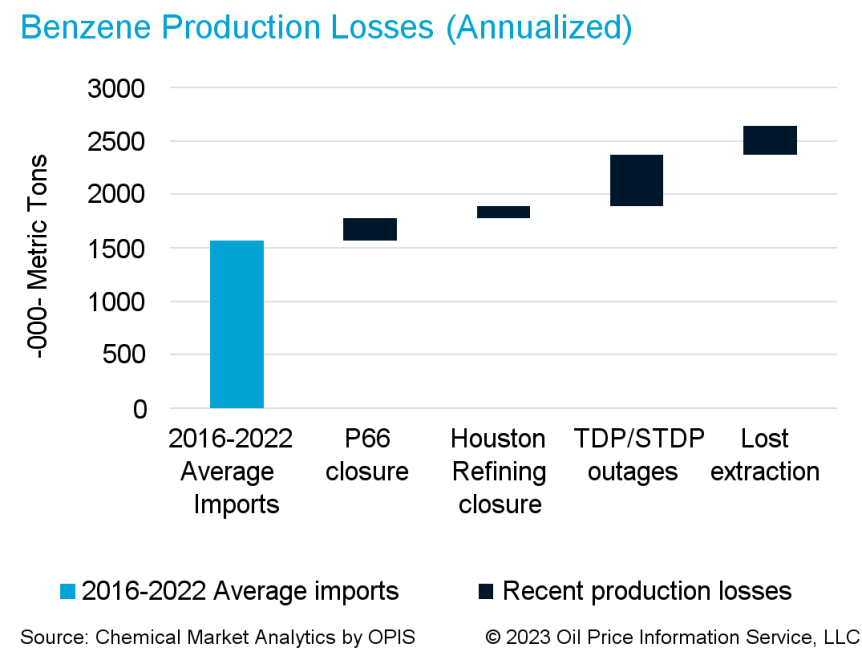
There were also several structural events that impacted the supply and demand balances for benzene and aromatics, including the permanent loss of the Phillips 66 Alliance Refinery at Belle Chasse, Louisiana, and the loss of benzene production from the LyondellBasell Houston Refinery which in aggregate totaled over 300 kt of benzene on an annualized basis as well as one-off weather-related events like winter storm Elliott which knocked out over 20% of US refining capacity around Christmas of 2022. OPIS (Oil Price Information Services) reported that 14 Gulf Coast refineries had been impacted by the storm, reducing operating rates to 76%. This further tightened fragile motor gasoline and gasoline component balances by the end of 2022.
Another issue we have not addressed is co-product benzene from steam crackers by way of pygas production and extraction. Steam crackers account for approximately 19% of North American benzene supply if crackers are running full and if their extraction units are filled with incremental imported pygas from abroad. However, as crude oil and naphtha prices increased, the oil to gas spread increased making ethane by far the most favored feedstock for ethylene production on a cash cost basis, meaning North American crackers produced very little pygas. In addition, demand for ethylene was also diminished by global economic slowdowns, thus North American crackers averaged about 80% run rates for most of 2022 and rates have not improved much in 2023.
So, not only were crackers reduced but feedslates were lighter than normal due to the favorability of ethane over LPG or naphtha feeds which produce significantly more pygas. Imports of pygas to fully utilize North American extraction capacity were also less available since cracker operating rates globally were even lower and the pygas had better value as a blend component versus extraction. Thus, extraction units were under-utilized for most of the year.
The Setup of 2023
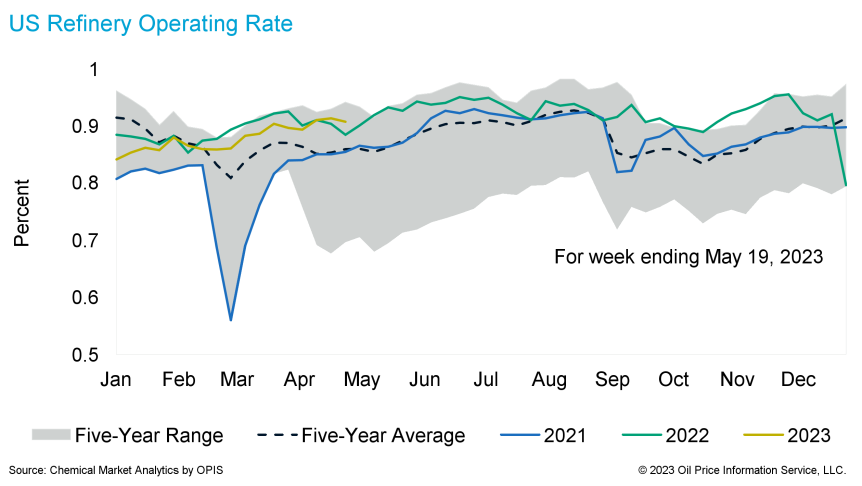
Given all the market dynamics and ending inventory positions of 2022, it looked as if 2023 might be a repeat of 2022 (albeit to a lesser extent), especially since refineries struggled the entire spring to get back to 90% operating rates. EIA data shows that refineries averaged 85-88% operating rates from January to April, and it was not until the week of 14 April that refineries broke the 90% ceiling. And the significance of refinery operating rates and production, particularly those in PADD III, are of great importance to benzene and aromatics balances since over 60% of the North American benzene supply is from refineries and their associated reformers and extraction units.
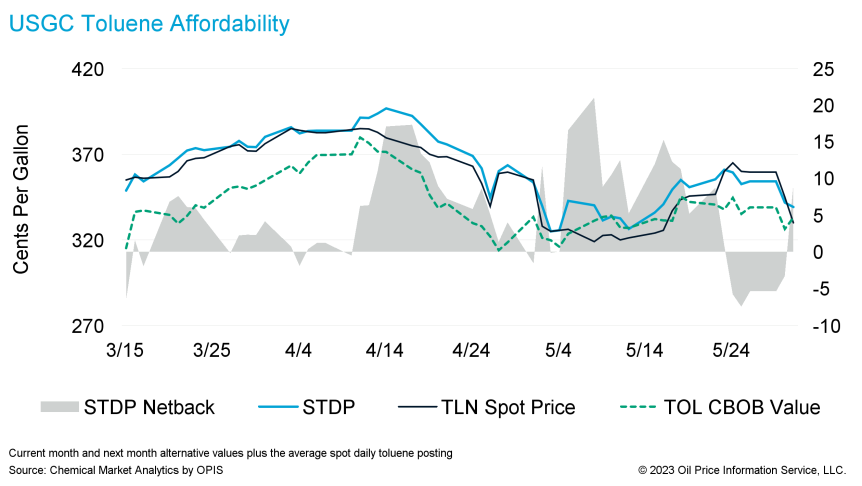
Thus far in 2023, total motor gasoline inventory averaged approximately 10 million barrels lower than 2022 and total motor gasoline inventory has set new five-year lows every week except for 2-3 weeks in early March. During this time, toluene prices dropped enough such that several STDP units were returned to operation and benzene co-production increased. That said, toluene conversion economics are still not great as shown in the USGC Toluene Affordability chart, and it is understood that several of these units may idle again if not already idled, tightening domestic benzene production. Additionally, cracker operating rates and extraction units have continued to underrun given the lack of demand for polyolefins, and this has limited overall aromatics availability from a supply perspective. Thus, the only other supply side opportunity to close the supply and demand balances for benzene and other aromatics is imports.
The Importance of Imports
We have covered quite a myriad of issues on the production and supply side of benzene, but another significant benzene supply source is by way of imports other than pygas. North America typically imports approximately 1.5 million tons of benzene per year or about 20% of its overall supply assuming benzene derivatives are running full. Essentially, North America imports benzene so that it can export incremental styrene to the rest of the world, taking advantage of its cost position in ethylene and natural gas.
For the most part, imports are opportunistic and less structural even though South Korea and Western Europe are larger regular exporters of benzene to the US Gulf Coast. The extended supply chain, exacerbated by price volatility of the various import and export regions, creates uneven ratability which creates even greater price volatility and price regional price dislocations as markets swing from long to short or from short to shorter as has been the case in 2022 and 2023.
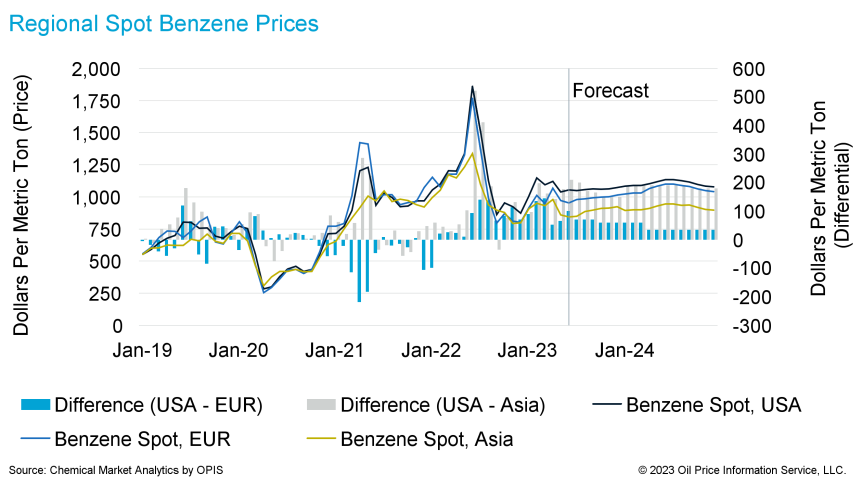
While regional prices have been more volatile and disconnected post-COVID, the US Gulf Coast has garnered product sporadically, if not regularly, even though freight rates remain exceptionally high relative to historic norms. Freight rates on many trade lanes are double or more compared to typical rates seen pre-COVID and they have not returned to prior levels. Regardless, recent import and export statistics show that South Korea continues to be the largest supplier to the US Gulf Coast, but timing and ratability is a significant issue which often pushes the market into boom or bust price regimes.
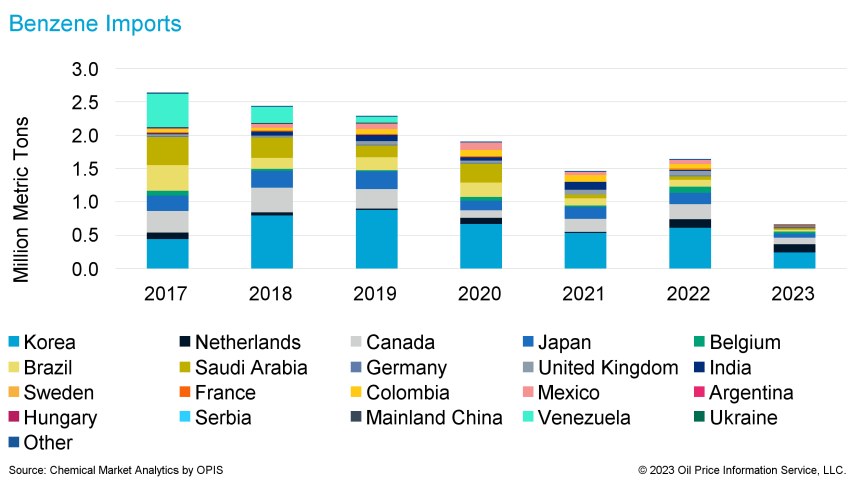
This has been especially true so far in 2023 as exports from South Korea ballooned in February, March and April, likely from a lack of demand in China, resulting in a more satisfied market in the second quarter even if the May contract price escalated and settled at $3.91 per gallon on expectations of tightness.
As stated, imports can help narrow the balances, but imports cannot close the balances given the myriad of supply-side constraints and limitations as previously discussed. The chart shows that if benzene derivatives were planned to run at full rates, the US Gulf Coast would need to import nearer 2.5 million mt per year or 200 kt per month to close the balances and history shows that we are incapable of importing this quantity of material on a sustained basis. Thus, the only other means of closing the benzene balances is by way of demand destruction rather than increased production or the unlikely prospect of record-setting imports.
The Destruction of Demand
As stated above, the only realistic opportunity to narrow or close the benzene balance is demand destruction. Given that most of the benzene derivatives other than styrene monomer price are on a benzene-plus basis, the swing demand is export styrene production. This is not to say that all styrene exports are “equal” since Mexico and South America are often considered “domestic” demand because the majority of this volume is contracted. Exports to Asia, the Middle East, and Western Europe are swing, opportunistic exports.
In a normal year, If the US Gulf Coast imports 1.5 million tons of benzene, this is essentially equivalent to 2.25 million tons of equivalent styrene production. On average, the US exports approximately 2 million tons of styrene per year including to Mexico and South America, so again it can be easily deducted that all the benzene imports are used for styrene exports. If we exclude Mexican and South American styrene demand estimated at 1 million tons per year, swing styrene exports total about 1 million mt per year or 0.8 million mt per year of benzene equivalents.
Thus, by difference, the simple mathematics says that if we import 1.5 million mt per year of benzene, we are able to satisfy domestic, Mexican and South American styrene monomer demand, but there is no incremental benzene available to produce and export styrene to Asia, the Middle East, or Western Europe. This would peg North American styrene monomer operating rates at approximately 80%.
Another wrinkle, which brings benzene demand (destruction), octane production and octane demand into the same circle as discussed at the beginning of this article is the ongoing sale of ethylbenzene into the gasoline blend pool. Last year, ethylbenzene, which is a precursor for styrene production, was stumbled upon by traders and blenders. Ethylbenzene off a styrene monomer unit is essentially a “pure” component with high octane and low RVP. This makes it a great gasoline blend component. Traditionally, ethylbenzene would not be available for blending assuming styrene monomer margins were positive and styrene exports were profitable. However, styrene monomer demand has been dreadful, and profitability has been poor. Thus, some styrene monomer producers were more than willing to sell ethylbenzene into the gasoline blend pool at positive margins to boost both operating rates and incremental variable margins. It can be argued whether this is a good strategic choice, since this increases incremental benzene demand that otherwise would not exist and probably raises the incremental price of benzene, but who can argue with an opportunity to boost short-term profitability when the industry is suffering? For this reason, several styrene monomer producers regularly sold ethylbenzene into the blend market when styrene exports were economically challenged. These sales, while not regular or ratable, have continued opportunistically since August of last year to the extent of logistics capacity and will likely not be discontinued until such a time as styrene becomes more profitable.
Outlook
Bringing us back to the beginning, most if not everyone expected firmer gasoline, firmer octane, firmer aromatics, and higher benzene prices given the starting point this year relative to the last year. Despite the OPEC+ announcement of reduced crude production in early April, energy prices have weakened for the most part. In fact, most products including aromatics and benzene have had trouble sustaining any positive momentum, particularly after the most recent Federal Reserve announcement increasing interest rates (again) by another one-quarter percentage point in early May.
Sentiment is weak and most outlooks for the second half of this year are bearish. Even mainland China which has historically grown at an annualized rate in excess of 5% has recently seen its growth projections cut to less than 5% per annum for 2023 and 2024 according to recent Oxford Economics reports. Clearly, the Chinese are operating at low rates as well which has allowed more aromatics, including benzene, toluene, mixed xylenes, and paraxylene to ship from South Korea to the US. This to a large extent, has prevented prices from running up; that and in conjunction with the fear, uncertainty, and doubt about global economies and their potential growth rates given Central Bank interest rate hikes.
Once again, the symbolic beginning of the summer driving season is upon us and we will know very soon if benzene is going to boom or if benzene is going to bust!
Author

James Nicholson
Executive Director
Learn how we can help you prepare and navigate market today.

