Carbon Markets: As Free Allowance Phaseout Looms, EU Chemical Plants Face Significant Expense
By:
- Anthony Lane, Reporter, Associate Director, OPIS
- Guadalupe Ruiz, Principal Data Scientist, OPIS
This article was originally published in OPIS CAMIRO (Carbon Analytics, Market Intelligence and Regulatory Outlooks), learn more about CAMIRO.
The EU industry has been paying a market-based carbon price since 2005. The EU Emissions Trading System (EU ETS) requires industrial operators to acquire one carbon allowance for every metric ton of carbon they emit.
The EU ETS covers around 10,000 installations across different industries, including oil refineries, steel works, iron production, aluminium, metals, cement, acids, bulk organic chemicals, lime, glass, and more, as well as the power generation sector.
The EU ETS covers around 10,000 installations across different industries, including oil refineries, steel works, iron production, aluminium, metals, cement, acids, bulk organic chemicals, lime, glass, and more, as well as the power generation sector.
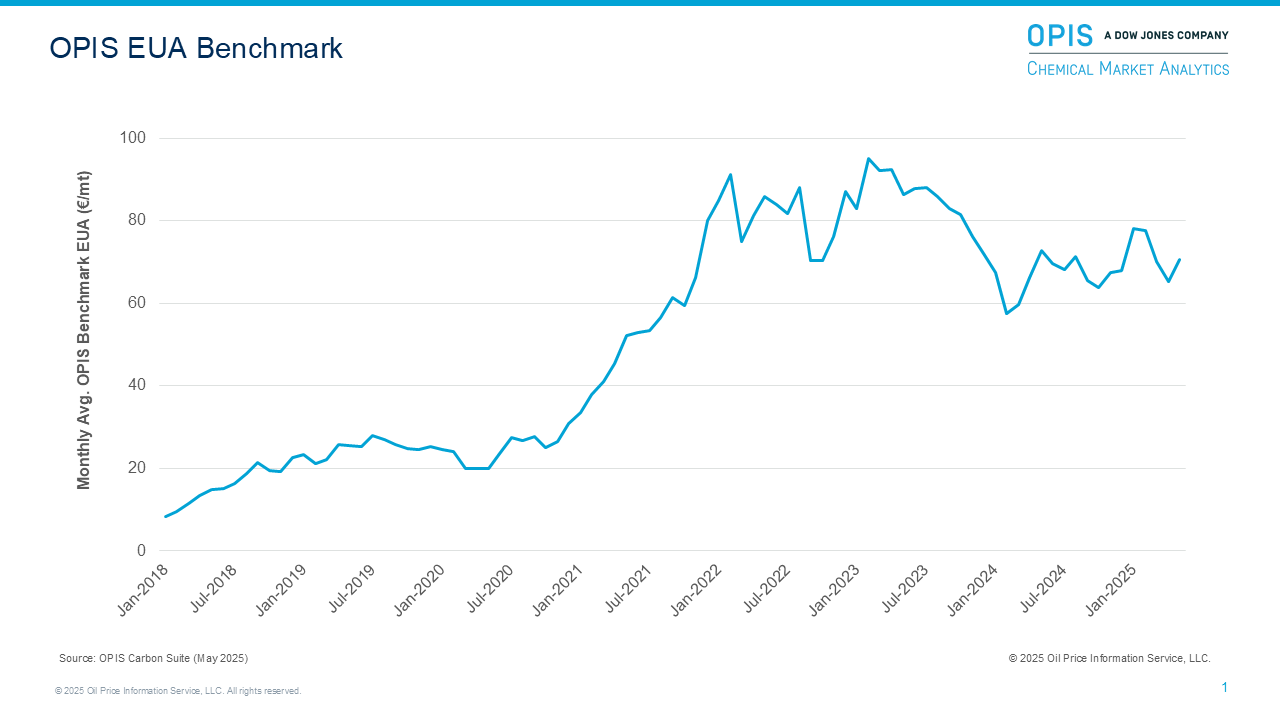
Carbon prices and EU Allowances (EUAs) are a significant cost component for many European operators and are projected to rise as the number of allowances auctioned every year falls by more than 4% per annum, and free allowances are gradually phased out. Additionally, by creating the EU Carbon Border Adjustment Mechanism (CBAM), the European Union will apply its carbon price to imports.
This article analyzes the expected carbon cost hikes for the largest carbon-emitting bulk chemicals, ammonia and soda ash installations (i.e. production units/ lines) in the European Union, as well as proposed changes in late May to the EU CBAM’s scope.
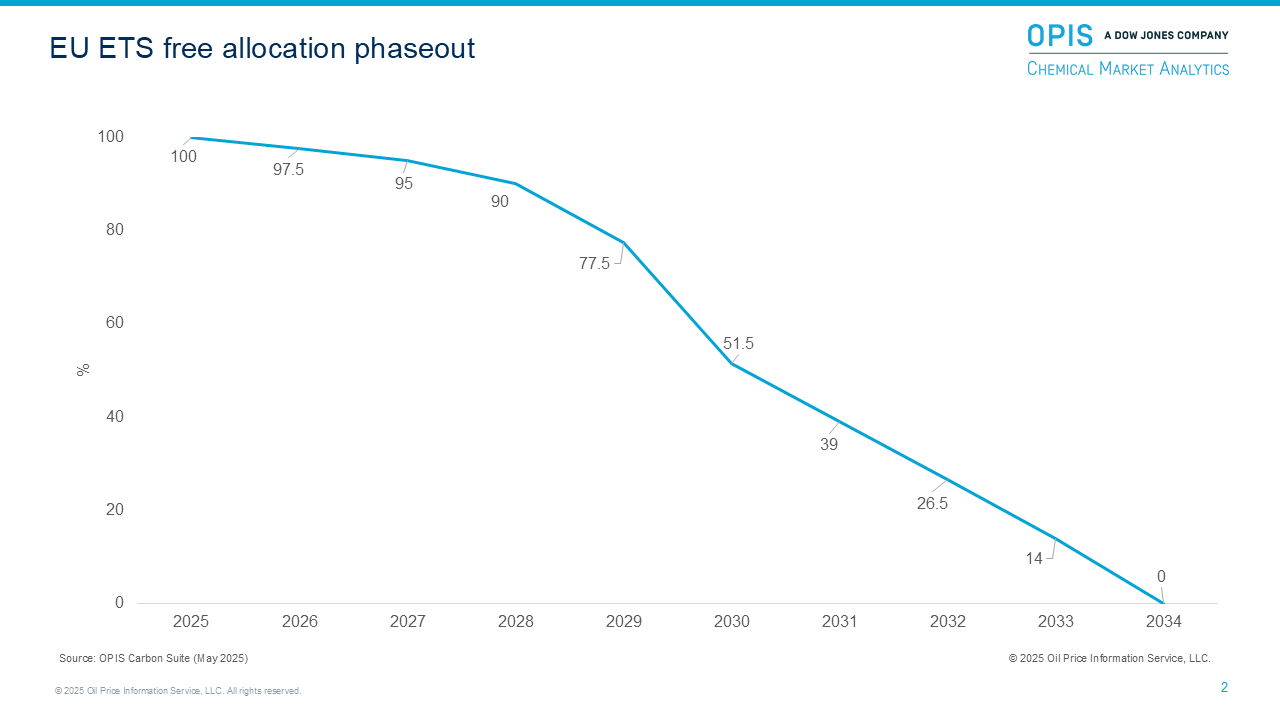
Free EUAs will be phased out by 2034
In countries subject to the EU ETS, each member state hands out free EUAs on an annual basis to eligible installations in “hard-to-abate” economic sectors, such as chemicals, steel, cement, and others, to cover carbon emissions costs. The free allowances are an incentive to remain within the European Union rather than relocating to regions where there are no carbon levies, i.e., carbon leakage.
Notably, if producers cut their emissions, they can sell surplus free allowances to other emitters, thereby profiting from decarbonizing their assets. Approximately 40% of the EUAs created each year in the cap-and-trade EU ETS are free allowances. Critics of free allowance allocation have long contended that the system does not encourage industrial operators to make large investments in decarbonizing their assets.
That said, the EU’s free allowance phaseout will begin in 2026 and span eight years. This could give the affected sectors a multibillion-euro carbon bill every year until 2034 if installations do not decarbonize.
Chemical assets will have large carbon bill hikes
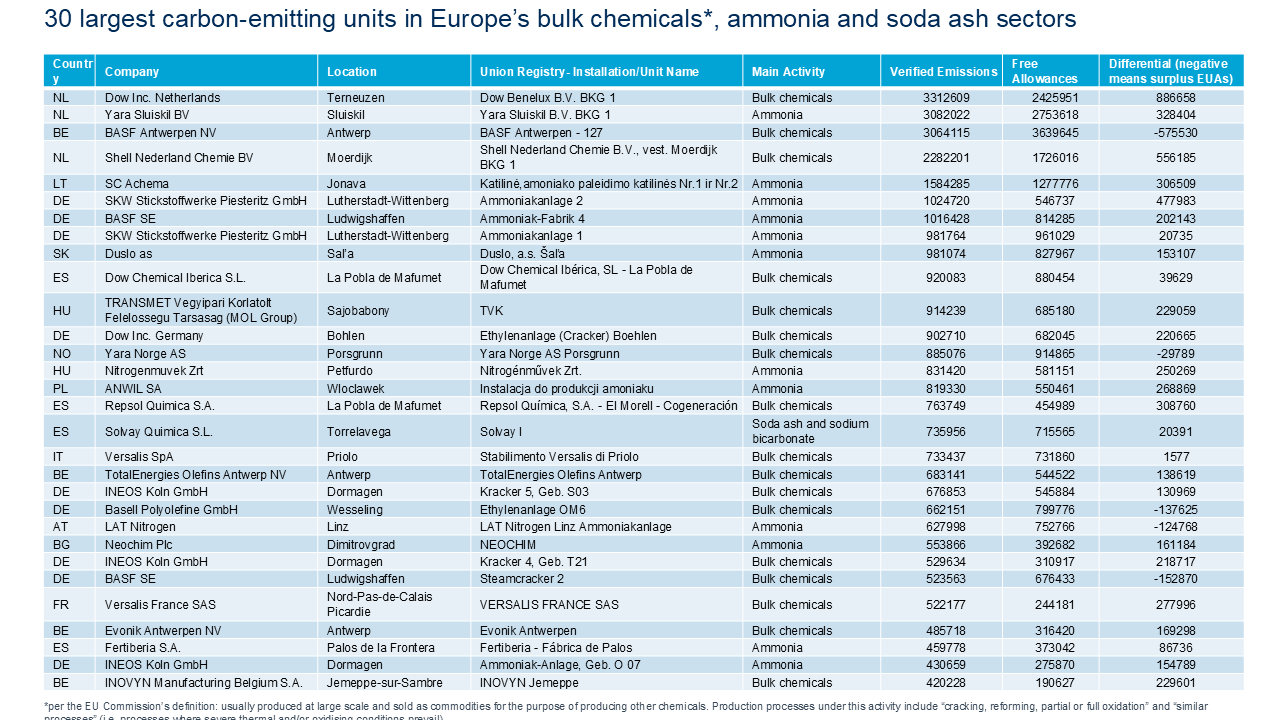
Looking into chemicals specifically, the 30 largest carbon-emitting installations in Europe’s bulk chemicals (EU Commission definition), ammonia, and soda ash sectors, which are listed in the adjacent table, collectively received 26.6 million free EUAs in 2024 according to the OPIS Carbon Suite analysis.
Those operators were shielded from paying for most of their emissions, which combined amounted to 31.4 million metric tons of carbon equivalent in 2024. The free allowances also mean that most EU chemical installations do not have to cover the majority of their emissions by buying EUAs via primary market auctions on the EEX exchange or on the ICE-operated secondary market.
The largest emitter on the list, an installation at Dow’s Terneuzen plant in the Netherlands, emitted 3.3 million metric tons of CO2e but received 2.4 million free allowances, hence the operator will have to buy or source nearly 887,000 allowances to meet its obligation to surrender allowances by the 30 September 2025 deadline. These benchmark allowances were assessed by OPIS at €71.815 on 27 May 2025 and would cost €63.7 million if the operator has not hedged its EUAs exposure and must still buy allowances.
These hefty carbon costs add to the challenge of navigating the cycle trough, as current market conditions are already squeezing chemical producers’ margins. Notably, Dow plans to skip an upcoming turnaround for one of its three Terneuzen crackers, intending to idle it instead when the next legal inspection is due this year. Other chemical companies could also opt to do this when facing the next turnaround, especially for higher cost, older assets; Rising carbon emission bills may contribute to this decision.
In the case of 5 of the highest-emitting 30 installations, the operators’ free allowances exceeded their emissions. Those operators can simply return the free allowances to the domestic ETS authorities by the compliance deadline. The companies can then bank or sell any surplus allowances.
Last year, an installation within BASF’s Antwerp complex had the largest free EUAs surplus for a bulk chemicals installation. It emitted 3.1 million metric tons of carbon and received 3.6 million free allowances. This surplus would be worth €41.33 million based on the 27 May 2025 OPIS-assessed benchmark EUAs price.
OPIS has forecasted what the average EUA price will be by the time free allowances are completely phased out in 2034. If that price were applied to the emissions produced in 2024 by the top 30 bulk chemicals, ammonia, and soda ash installations subject to the EU ETS, the combined costs of surrendering allowances would reach €6.51 billion for these assets alone.
Phasing out EUAs while preserving domestic competitiveness: CBAM comes into play
The European Union is attempting to phase out free allowances in a way that avoids disadvantaging domestic operators exposed to foreign competitors. The European Union aims to do this via its CBAM. Sectors covered by the CBAM currently include cement, steel, iron, aluminium, ammonia, hydrogen, and electricity.
The CBAM will apply an EUAs-based levy to carbon emissions from imports across several sectors, including chemicals. This means the CBAM levy will follow EU carbon prices: The levy will be phased in from 2026 until the full EU carbon price is applied in 2034 forward, thus gradually coming into full effect at the EUAs phaseout rate.
Upcoming changes to the CBAM scope
The Council of the European Union and the EU Parliament will begin negotiating the final changes to simplify the CBAM in the last week of May, following the council’s support of the EU Commission’s proposed amendments.
On 27 May, the Council of the EU, which represents the governments of the bloc’s 27 member states, announced that it was in favor of the EU Commission’s proposed amendments to the CBAM to “reduce the regulatory and administrative burden” and compliance costs for small- and medium-sized enterprises.
Chief among the proposed changes is broadening the threshold that would trigger an EU importer’s compliance with the CBAM. Currently, shipment values worth more than €150 in CBAM-covered goods must comply with the tariff. A higher threshold has now been proposed: a mass tonnage-based threshold of 50 metric tons of imported goods per importer over a 12-month period, which is expected to exclude 90% of EU importers from the CBAM while still covering 99% of emissions from larger businesses.
That said, for chemical commodities, this change is of little consequence due to these products’ typical trading volumes. For some speciality products, however, it could be a welcome simplification.
Of greater importance to the wider chemical industry is the upcoming revision to the planned scope of the CBAM extension to cover organic chemicals and polymers by the end of this year. This could lead to these sectors’ potential inclusion by 2030.
As the EU industry struggles, carbon price adders could accelerate rationalization
As the EU phases out EUAs and carbon bills rise for many chemical companies in the region, the rationalization wave could be exacerbated. The global chemical industry is navigating a long downcycle, with annual average margins declining since 2021, and the bottom of the trough has not been reached yet.
Chemical Market Analytics expects global average margins to remain below 2010–19 historical averages on a real basis well into the 2030s, exacerbated by the economic fallout from the current trade tensions.
Many European assets are already among the highest cost for their respective global value chains, with global corporations widely assessing their European assets. Every quarter, more and more plants are added to the at-risk list. The upcoming EUA phaseout and the subsequent rising carbon costs could be one more nail in the coffin for several European chemical assets.
Looking for more carbon market intelligence like this?
CAMIRO- Carbon & Clean Fuels Analytics, Market Intelligence & Regulatory Outlooks can help optimize your company’s strategy for compliance with carbon market and clean fuels regulations with real-time policy insights, sophisticated price forecasts, and analyst outlooks.
Request a no-obligation demo of CAMIRO here.