

How Will Our Cost Curves Help You Better Invest?
Plant-level Detail
Whether you’re modelling EBITDA for quarterly earnings, stress-testing credit, or evaluating an acquisition target, CMA gives you the plant-level intelligence to help you make better decisions.
Combined Offering
We now offer the combined value proposition of the long-term outlooks and insights alongside, plant-by-plant cash cost economics – we don’t believe any other competitor can offer this in a regularly updated, combined offering.
Truly Integrated
Our cost curves are integrated with feedstocks based on the knowledge of our experts and datasets and not just industry averages.
Get Started with CMA Cost Curves
Whether you’re modeling EBITDA for quarterly earnings, stress-testing credit, or evaluating an acquisition target, we give you the plant-level intelligence to help you make informed decisions.
Speak with our Capital Markets team about how this applies to your coverage
How Financial and Capital Markets Professionals Use Our Cost Curves to Gain Market Insight
The Question You’re Asking
“Can Company X refinance its 2027
maturities? What’s the downside?”
How Cost Curves Answer It
Identify which plants cover cash costs vs.
face closure risk under stress.
The Question You’re Asking
“Bond spreads have widened 100bps is
that pricing in too much risk?”
How Cost Curves Answer It
True breakeven with integration reveals
margin buffer before cash burn.
The Question You’re Asking
“What are these assets worth in
liquidation?”
How Cost Curves Answer It
Plant-by-plant cost position determines
keep vs. close decisions.
The Question You’re Asking
“Is Company Y a structural winner or
loser?”
How Cost Curves Answer It
Quartile positioning with integration shows
true competitive position.
The Question You’re Asking
“Is this target’s margin structural or
cyclical timing luck?”
How Cost Curves Answer It
Benchmark assets against global peers;
separate advantage from timing.
The Question You’re Asking
“Will this asset survive a 3-year margin
compression?”
How Cost Curves Answer It
Cost position determines resilience; Q1/Q2
assets survive, Q3/Q4 don’t.
Product Features
Interactive Dashboard Views
Multiple ways to view the data and understand the company and plant-level dynamics.
Global Cost Curve
Plot cumulative capacity against cash cost. Overlay demand to identify the marginal
producer — the asset that sets the market price.
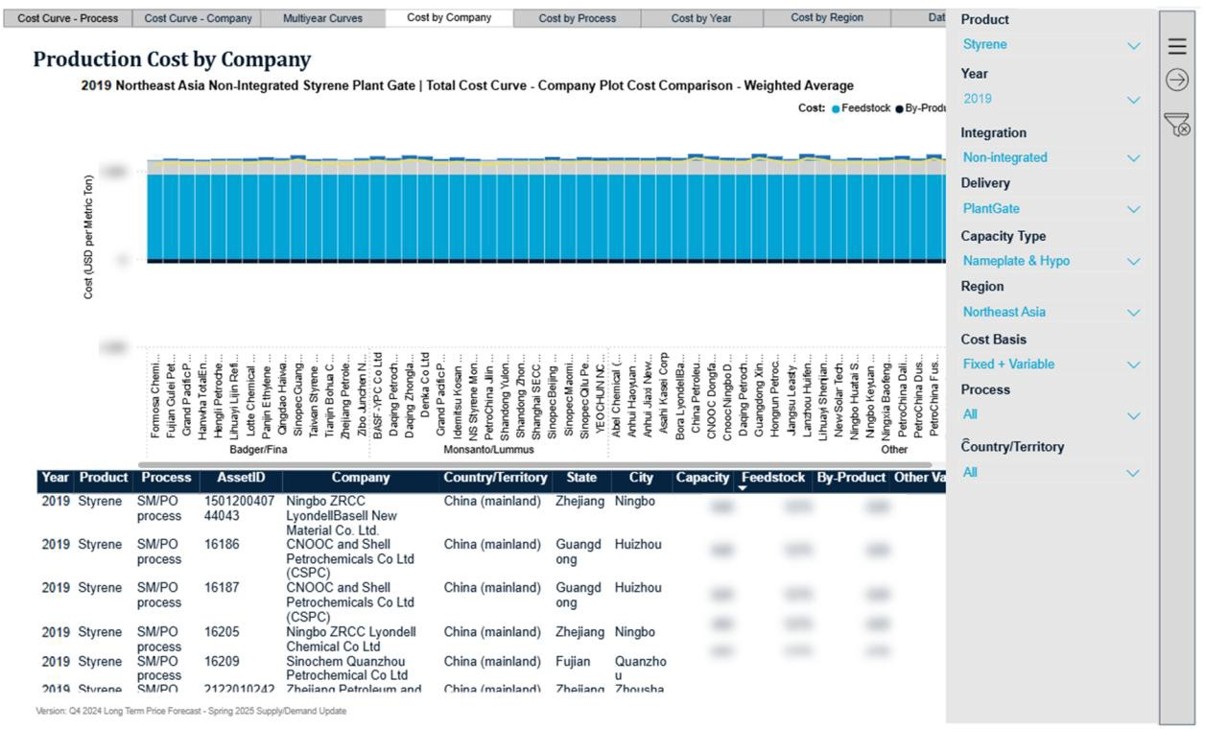
Cost by Company
Compare weighted average cash costs across producers. Deconstruct a target’s
portfolio to distinguish structural advantage from cyclical luck.
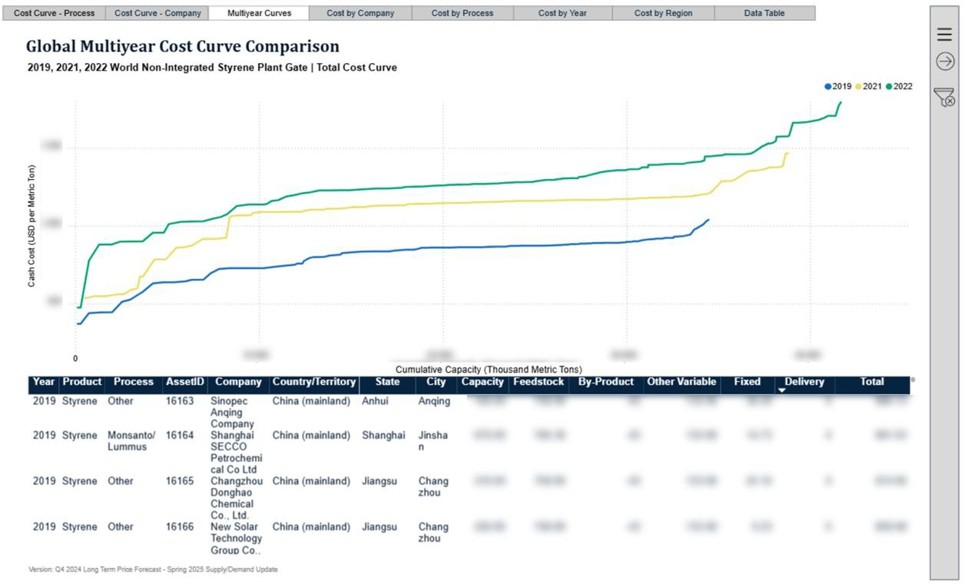
Multiyear Curves
Visualize how the cost structure shifts over time as new low-cost capacity comes online
and higher-cost producers are pushed right.
Economic Snapshot
Itemized breakdown of every cost component: feedstocks, byproducts, utilities,
labor, overhead. The unit economics finance professionals need for bottom-up P&L forecasts.
Excel Plotting Tool
Power-user sandbox with full control.