

Leverage your competitive edge with cost calculations for every facility in the world.
Understand how your production costs compare to competitors now and in the future to support strategic planning and investment decisions. Leverage our Cost Curves to analyze chemical price dynamics, identify which units will stay profitable or face challenges, assess cost and margin estimates for competing assets by location and technology, and gain deeper insights into the cost structures of raw material suppliers for more informed contract negotiations.
Actionable insights at your fingertips:
.
An interactive dashboard where you can view and download cost data for key chemicals including Ethylene, Polyethylene, Propylene, Polypropylene, Chlorine/Caustic Soda (ECU), Soda Ash, Methanol, and Monoethylene Glycol.
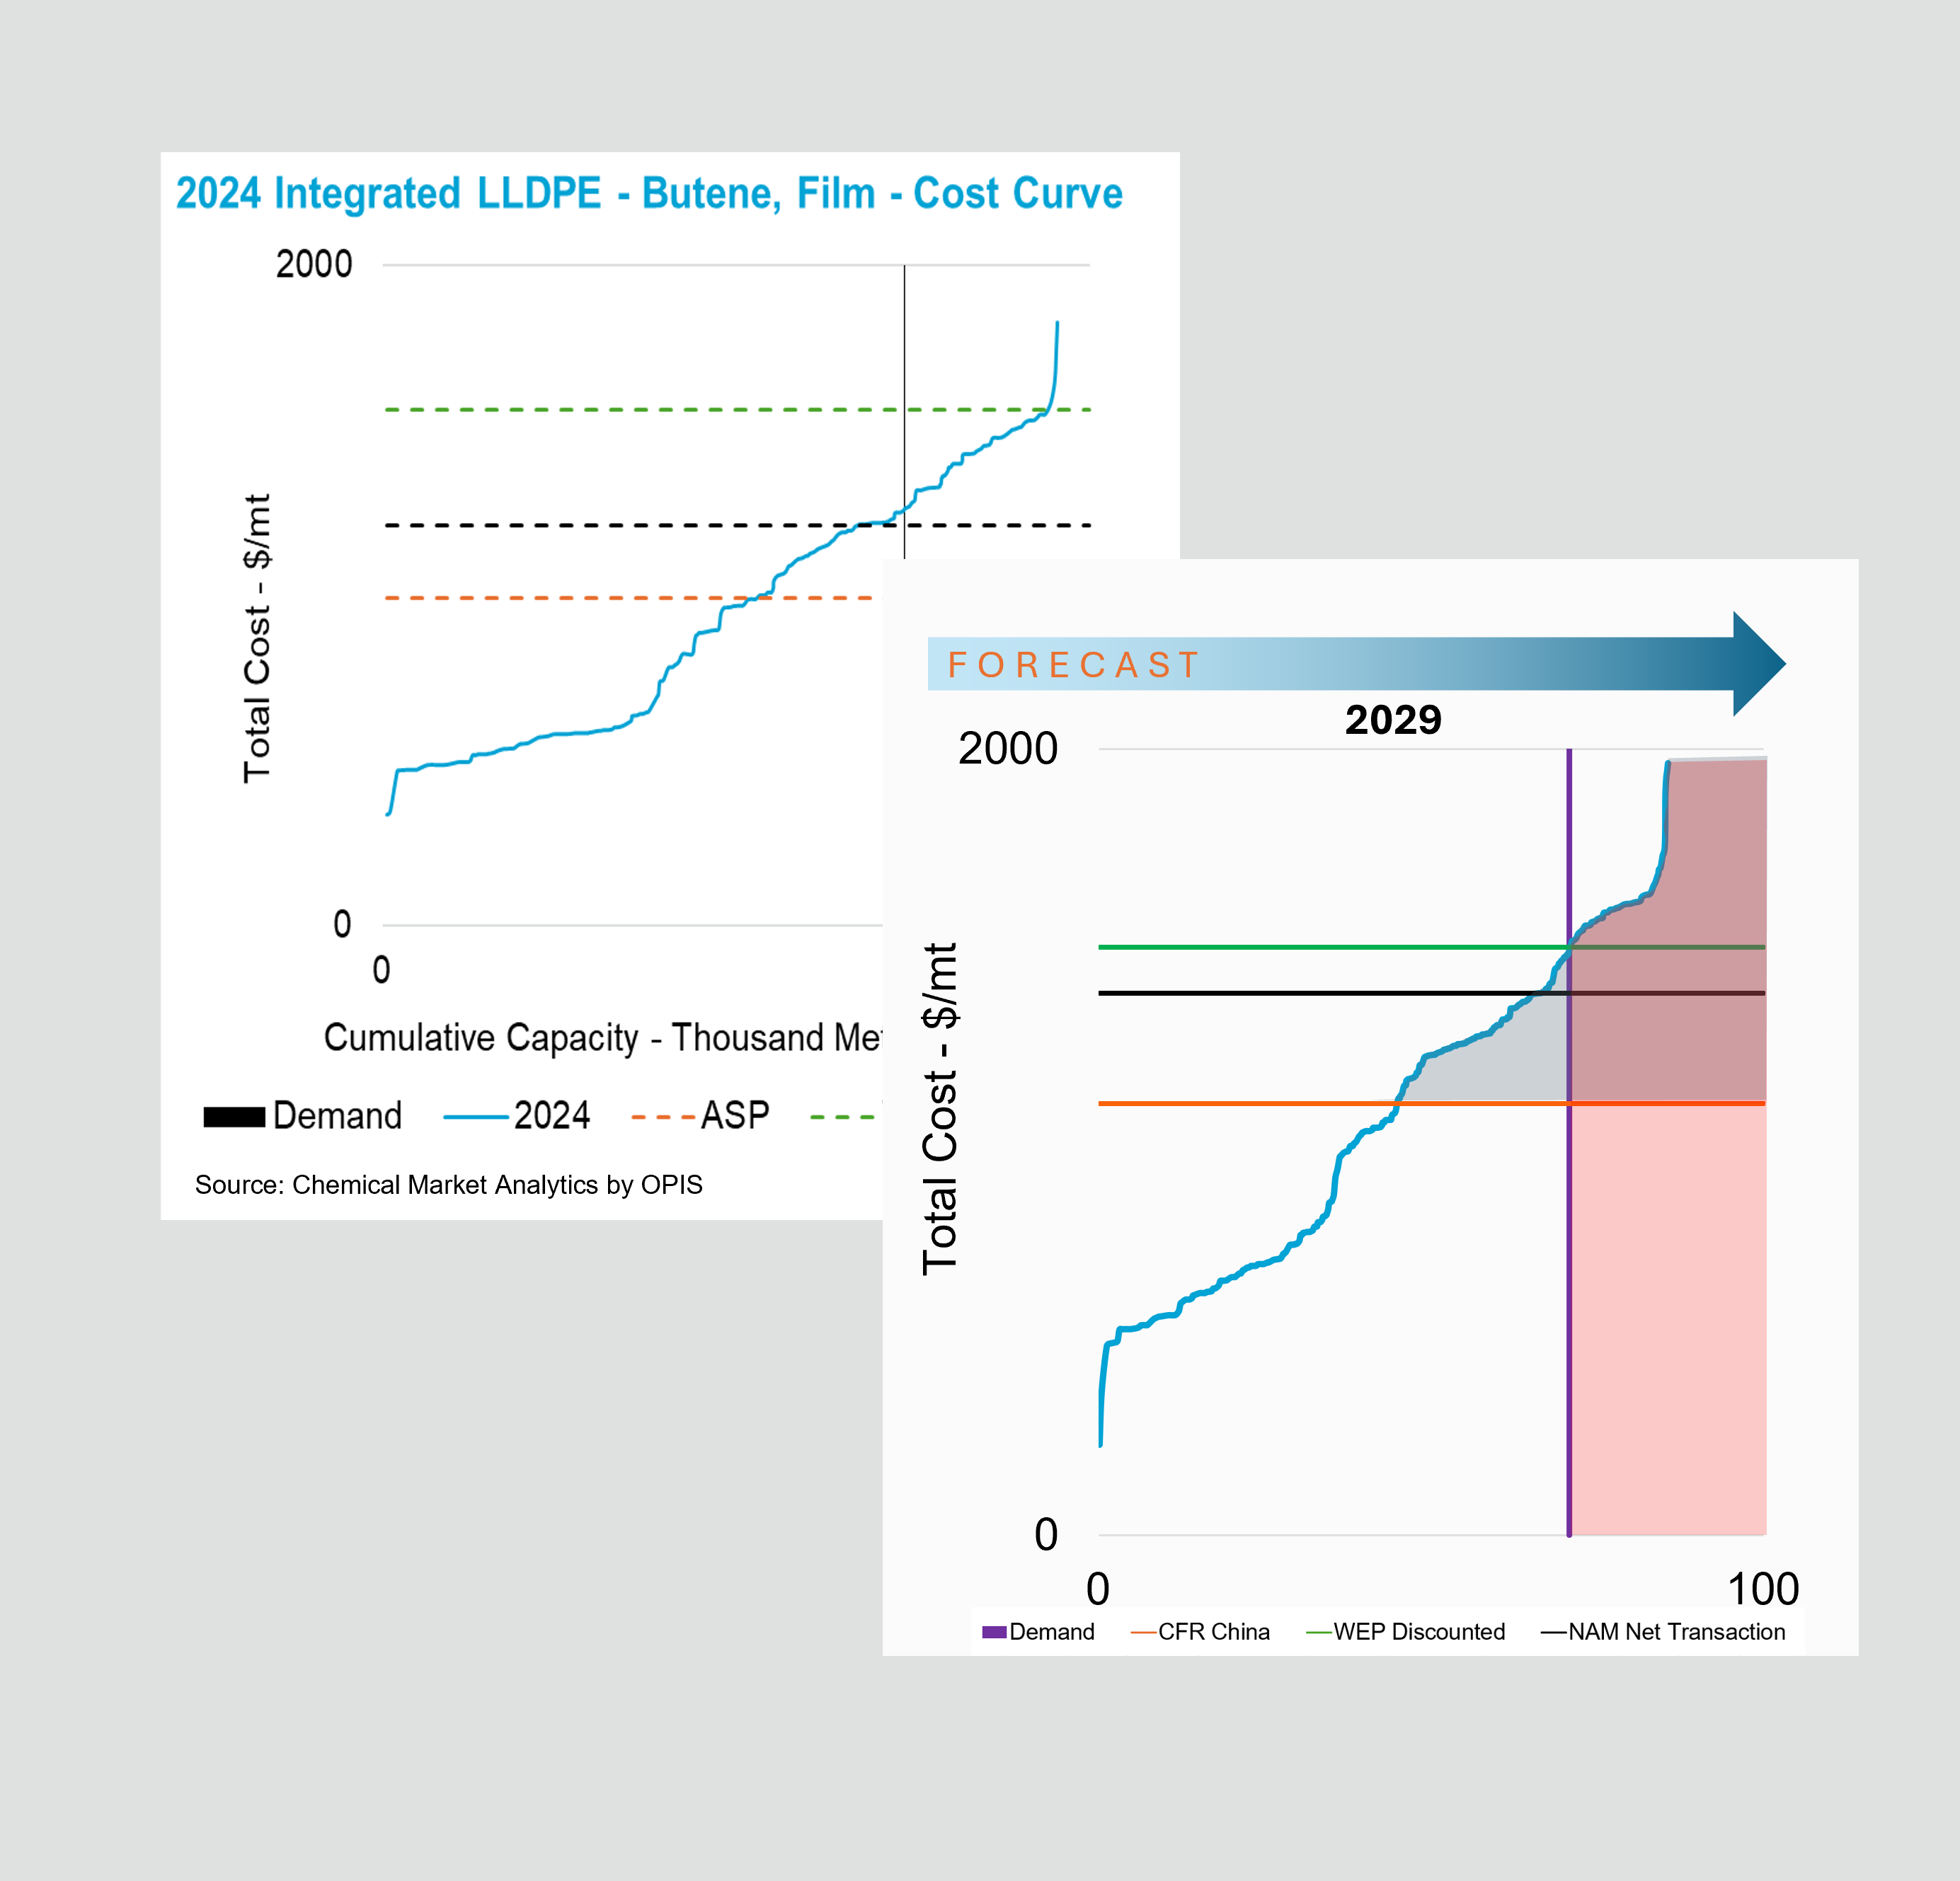
Gain insights with a comprehensive view: explore a 5-year historical analysis, a 10-year forecast, and key milestones for 2040 and 2050 as standalone reference points for strategic planning
Includes global and regional cost curves for North America, South America, West Europe, Central Europe, CIS & Baltic States, Africa, Middle East, Indian Subcontinent, China (mainland), Other Northeast Asia, and Southeast Asia.
Quarterly data updates for price forecasts and biannual for capacity.
Delivered costs can be selected for delivery to USGC, ARA, and China.
Includes integrated costs for facilities with feedstock and coproduct integration.
Backed by deep industry expertise, our Cost Curves are built on decades of global experience only available from the Chemical Market Analytics team.
Key Use Cases

Benchmark production costs
Compare your cost position to competitors.

Pinpoint import/export opportunities
Discover the most competitive regions.

Predict capacity impact
Explore the influence of new capacity or technology.

Evaluate Integration
Assess integrated feedstock or coproduct economics.

Asset valuation
Validate your calculated cost curves with our independent data.
Gain a Competitive Edge with Cost Curves by Chemical Market Analytics
Visualize plant-level production costs, compare them to regional prices and demand, and make smarter buying, selling, and negotiation decisions. Powered by trusted price assessments, market expertise, and robust supply/demand and economic models, our Cost Curve platform delivers independent, reliable insights to drive your strategy.
Designed for seamless use across your organization, its intuitive and interactive interface requires no specialist knowledge—empowering your team to take action instantly.
See it in action! Contact us today for a demo and let us amaze you.
Request for a Demo