

Leverage your competitive edge with cost calculations for every facility in the world.
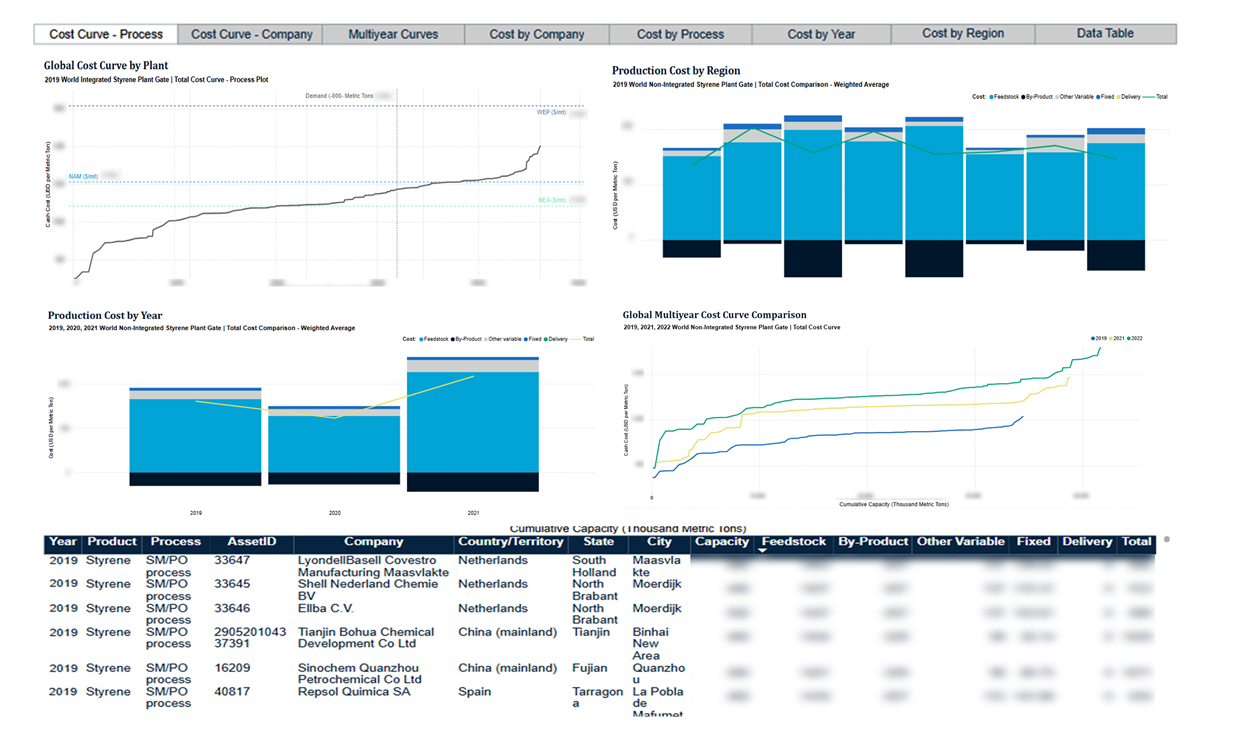
Understand how your production costs compare to competitors now and in the future to support strategic planning and investment decisions. Leverage our Cost Curves to analyze chemical price dynamics, identify which units will stay profitable or face challenges, assess cost and margin estimates for competing assets by location and technology, and gain deeper insights into the cost structures of raw material suppliers for more informed contract negotiations.
Key Features
.
Access to an interactive dashboard, an Excel plotting tool, and economic snapshots.
Olefins & Derivatives
– Ethylene
– Propylene
– Propylene Oxide
– Butadiene
– Monoethylene Glycol
Aromatics & Fibers
– Benzene
– Paraxylene
– Styrene
– Toluene
– Mixed Xylenes
Plastics & Polymers
– Polyethylene (HDPE, LDPE, LLDPE)
– Polypropylene
– Polystyrene
Syngas Chemicals
– Acetic Acid
– Vinyl Acetate
– Methanol
Inorganics Chemicals
– Chlor-Alkali
– Soda Ash
– Polyvinyl Chloride
Quarterly data updates aligned with our long-term price forecasts and biannual supply/demand balances.
Curves shown with five years of history, ten years of forecast, plus 2040, 2050, and 2060.
Global capacity data by company, location, plant age, and process technology.
Regional market price data to support margin analysis.
Delivery cost estimates to Amsterdam/Rotterdam/Antwerp (ARA), Houston, and Shanghai.
Plant-level production cash cost estimates for all major technologies and regional market price data to
support margin analysis.
Plant costs on both integrated and non-integrated bases, including integration ratios.
Key Use Cases

Competitive Analysis
– Peer evaluation
– Import threats
– Export opportunities

Strategic Planning
– Supply diversity
– Invest or divest
– Make vs. buy

Market Factors
– Feedstock integration
– Coproduct splits
– Energy consumption

Plant Cost Drivers
– Feedstock integration
– Coproduct splits
– Energy consumption
What Drives Our Cost Curve Model?
Chemical Market Analytics synthesizes millions of data points into a unified Cost Curve model, validated by a global team of more than 200 industry experts. This proprietary framework is built on three core pillars: macro market economics, operational and logistical dynamics, and detailed plant-level specifications, providing a robust, data-driven foundation for cost benchmarking and strategic decision-making across the chemical value chain.
Contact us for a demo or learn more about subscribing.
Request for a Demo